Sunday, 3 December, 2023
  • Home
  • Disclaimer
  • Privacy Policy
  • Terms & Conditions
  • Login
Shubhlaxmi Commodity
Advertisement
  • Home
  • Commodity
    • International Commodity Live
  • Apps
  • Tools
    • MCX Market Trend
    • Indian Stock Market Holiday
    • Ncdex Price Volume & Open Interest
  • Contact
    • Terms & Conditions
    • Disclaimer
    • Privacy Policy
Plugin Install : Cart Icon need WooCommerce plugin to be installed.
No Result
View All Result
Shubhlaxmi Commodity
  • Home
  • Commodity
    • International Commodity Live
  • Apps
  • Tools
    • MCX Market Trend
    • Indian Stock Market Holiday
    • Ncdex Price Volume & Open Interest
  • Contact
    • Terms & Conditions
    • Disclaimer
    • Privacy Policy
No Result
View All Result
Shubhlaxmi Commodity
No Result
View All Result
Home Uncategorized

Copper cracking down the lower channel line

Shubhlaxmi Support Team by Shubhlaxmi Support Team
September 7, 2021
in Uncategorized
0

You might also like

Forex Currency Real Time Quotes

LME Aluminiuam Technical Chart

LME Nickel Technical Chart

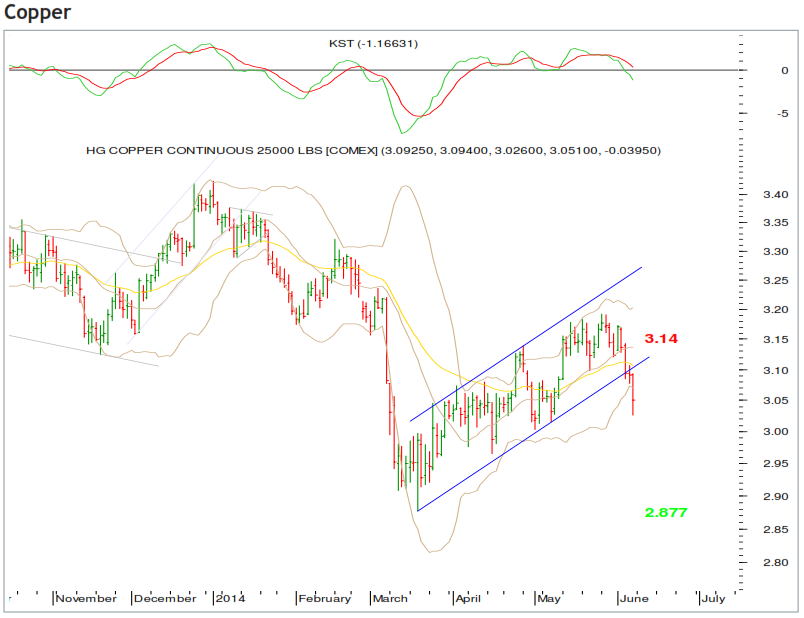
COMEX copper Recently the price broke the key daily moving averages as well as the lower channel line. The daily momentum indicator is in bearish mode whereas the weekly momentum indicator has completed the pull-back cycle and is ready for a new cycle on the downside. Thus, copper looks poised for a fall till the recent low, ie $2.877. A reversal of the bearish view can be placed above the key daily moving averages,ie at $3.14.
Previous Post

Lead showing bullish potential

Next Post

MCX zinc has formed a triangular pattern

Shubhlaxmi Support Team

Shubhlaxmi Support Team

Related Posts

Forex Currency Real Time Quotes
Uncategorized

Forex Currency Real Time Quotes

by Shubhlaxmi Support Team
August 16, 2022
0
Uncategorized

LME Aluminiuam Technical Chart

by Shubhlaxmi Support Team
September 7, 2021
0
Uncategorized

LME Nickel Technical Chart

by Shubhlaxmi Support Team
September 7, 2021
0
Uncategorized

LME Copper Technical Chart

by Shubhlaxmi Support Team
September 7, 2021
0
Uncategorized

Crude Oil Technical Chart

by Shubhlaxmi Support Team
September 7, 2021
0
Next Post

MCX zinc has formed a triangular pattern

Leave a Reply Cancel reply

Your email address will not be published. Required fields are marked *

  • #568 (no title)
  • Commodity Live
  • Disclaimer
  • MCX Daily Pivot Points
  • Page Under Construction
  • Privacy Policy
  • Terms & Conditions
Call us: 09221548869

© 2023 Team Shubhlaxmi

No Result
View All Result
  • Home
  • Commodity
    • International Commodity Live
  • Apps
  • Tools
    • MCX Market Trend
    • Indian Stock Market Holiday
    • Ncdex Price Volume & Open Interest
  • Contact
    • Terms & Conditions
    • Disclaimer
    • Privacy Policy

© 2023 Team Shubhlaxmi

Welcome Back!

Login to your account below

Forgotten Password?

Retrieve your password

Please enter your username or email address to reset your password.

Log In
This website uses cookies. By continuing to use this website you are giving consent to cookies being used. Visit our Privacy and Cookie Policy.